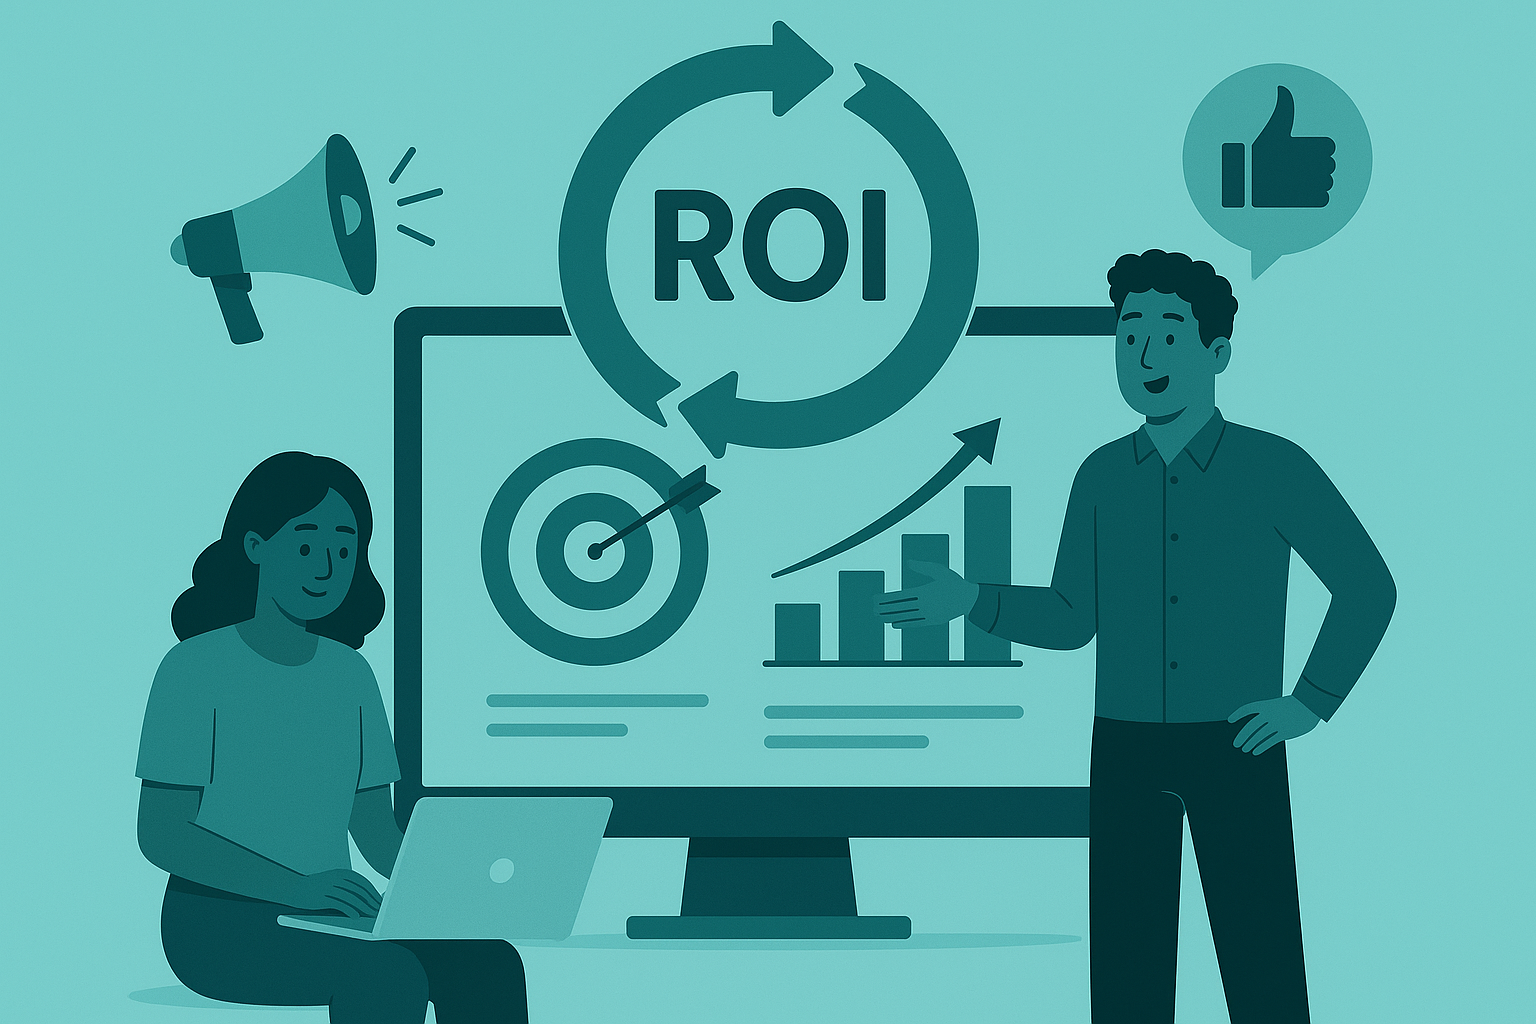
Digital Marketing ROI Examples: Methodologies and Proven Strategies
Introduction
ROI stands for “return on investment” and traditionally measures revenue generated minus marketing costs, divided by marketing costs, times 100. But here’s the problem: if you spend $1,000 on ads and generate $3,000 in revenue, the traditional ROI calculation shows 200%. However, if your cost of goods sold and fulfillment costs are $2,500, you actually lost $500 on that campaign. You’re going out of business while your ROI looks great on paper.
That’s why smart marketers calculate Net ROI instead: (Profit / Marketing Investment) × 100. Using the same example with $3,000 revenue, $2,500 fulfillment costs, and $1,000 ad spend: (-$500 loss / $1,000 marketing) × 100 = -50% Net ROI. This clearly shows you’re losing money, which is much more accurate than the misleading 200% from revenue-based calculations.
Without tracking Net ROI, you’re flying blind with your marketing budget.
This article breaks down Net ROI examples across every major digital channel, shows you realistic numbers from typical campaigns, and gives you the formulas to calculate your own.
Understanding Digital Marketing ROI
Digital marketing adds complexity because customers often interact with multiple touchpoints before buying. Someone might see your Instagram ad, Google your brand, read your blog, then buy three weeks later. Attributing that sale to the right channel determines whether you think Instagram ads work or not. This can be solved partially using marketing attribution models such as time decay attribution or linear attribution. There are many different attribution models available - just know that they exist and can help distribute credit across multiple touchpoints.
Track these core metrics: cost per acquisition (CPA), customer lifetime value (CLV), conversion rate, and average order value (AOV). These four numbers tell you if your campaigns actually make money.
Challenges in Measuring Digital Marketing ROI
Most businesses mess up ROI tracking because they can’t connect sales to specific marketing activities. If someone clicks your Google ad but buys in-store two days later, Google Analytics shows zero revenue from that click.
B2B companies face longer sales cycles where a LinkedIn ad might generate a lead that becomes a customer 6 months later. E-commerce has it easier with immediate online purchases, but even they struggle with return customers who no longer click ads.
The biggest challenge is separating correlation from causation. Just because sales increased after running Facebook ads doesn’t mean Facebook caused the increase.
ROI Examples by Digital Marketing Channel
Search Engine Marketing (SEM)
Google Ads typically delivers the highest measurable ROI because people are actively searching for your product.
Campaign Example: A plumbing company spent $2,400 on Google Ads over three months targeting “emergency plumber [city name]”. They received 48 calls, booked 31 jobs, and generated $18,600 in revenue. After subtracting $9,300 in labor and material costs, their profit was $6,900. Net ROI: ($6,900 / $2,400) × 100 = 288%.
Calculate SEM ROI by dividing profit by ad spend. If you want to be more precise, you can include ongoing optimization or CRO efforts in your marketing costs.
Track conversions using Google’s conversion tracking pixel on your thank-you page. Set up phone call tracking with dynamic number insertion to capture calls from ads.
Search Engine Optimization (SEO)
SEO ROI compounds over time because rankings improve gradually then maintain with minimal ongoing cost.
Campaign Example: A SaaS company invested $15,000 in SEO over 12 months (content creation, technical fixes, link building). Organic traffic increased from 2,000 to 8,000 monthly visitors, generating 60 new customers worth $108,000 in annual recurring revenue. Since SaaS has roughly 80% gross margins, profit was approximately $86,400. First-year Net ROI: ($86,400 / $15,000) × 100 = 476%.
SEO’s challenge is attribution timing. Rankings take 3-6 months to improve, and customers often convert weeks after their first visit. Be sure to include first touch reporting or assisted conversions to see SEO’s full impact.
Calculate long-term SEO ROI by projecting traffic growth over 2-3 years since rankings typically maintain with minimal ongoing investment.
Social Media Marketing
Paid social media ROI varies dramatically by platform and audience targeting.
Facebook Ads Example: An online jewelry store spent $1,200 targeting women ages 25-45 interested in handmade jewelry. The campaign generated 24 sales with an average order value of $150, totaling $3,600 in revenue. With a 60% gross margin (typical for handmade jewelry), profit was $2,160. Net ROI: ($2,160 / $1,200) × 100 = 180%.
LinkedIn Ads Example: A B2B software company spent $3,000 targeting CTOs at companies with 100+ employees. This generated 12 demo requests, resulting in 1 new customer worth $30,000 in annual contracts. With 85% gross margins typical in software, profit was $25,500. Net ROI: ($25,500 / $3,000) × 100 = 750%.
Organic social media ROI is extremely difficult to measure accurately because we likely don’t have a way to tie social media followers to website conversions or offline conversions. One possible way to measure organic social is to survey customers on how they discovered you, then apply that percentage to your overall sales. Keep in mind that organic social is likely one of many touchpoints that contributed to the sale. Focus organic efforts on relationship building and brand management rather than direct sales.
Email Marketing
Email consistently delivers the highest ROI of any digital channel, averaging $36 return for every $1 spent.
Newsletter Campaign Example: An e-commerce store with 50,000 subscribers spent $500 monthly on email platform costs plus 20 hours of labor ($800 in time). Monthly email campaigns generated $16,000 in attributed revenue. With a 45% gross margin, profit was $7,200. Net ROI: ($7,200 / $1,300) × 100 = 454%.
Automated Email Sequence Example: A course creator spent $2,000 building a 7-email welcome sequence for new subscribers. This sequence converts 2% of new subscribers into $197 course purchases. With 150 new subscribers monthly, the sequence generates $591 monthly revenue. Since digital courses have 95% profit margins, monthly profit is $561. Annual Net ROI including build cost: ($6,732 / $2,000) × 100 = 237%.
Track email ROI using UTM parameters in all email links to measure revenue in Google Analytics.
Content Marketing
Content marketing ROI builds slowly but creates lasting value through improved SEO and brand authority.
Blog Content Example: A marketing agency spent $8,000 creating 40 high-quality blog posts over 6 months. These posts ranked for 150+ keywords, driving 8,000 monthly organic visitors and generating 8 new client inquiries worth $80,000 in contracts. With 70% profit margins typical for agencies, profit was $56,000. Net ROI: ($56,000 / $8,000) × 100 = 600%.
Video Marketing Example: A fitness coach spent $5,000 producing 20 YouTube videos. Videos generated 200,000 views, 800 email subscribers, and 35 course sales at $199 each. With 90% profit margins on digital courses, profit was $6,267. Net ROI: ($6,267 / $5,000) × 100 = 125%.
Content ROI requires patience since most content takes 6-12 months to reach full traffic potential.
Display Advertising
Display ads work best for retargeting website visitors rather than cold audiences.
Retargeting Campaign Example: An online furniture store spent $1,800 retargeting 10,000 website visitors who didn’t purchase. The campaign reached 60% of visitors an average of 12 times each, generating 25 sales with an average order value of $600. With a 30% gross margin typical for furniture, profit was $4,500. Net ROI: ($4,500 / $1,800) × 100 = 150%.
Cold Display Advertising Example: The same furniture store spent $2,500 on banner ads targeting cold audiences interested in home decor. The campaign generated 2.1 million impressions and 1,050 clicks, resulting in only 3 sales with the same $600 average order value. With a 30% gross margin, profit was $540. Net ROI: ($540 / $2,500) × 100 = -78%. This negative ROI is typical for cold display advertising.
Cold display advertising typically delivers negative ROI due to banner blindness and poor targeting. Retargeting converts 2-3x higher because you’re reaching people already familiar with your brand.
Influencer Marketing
Influencer ROI depends heavily on audience alignment and follower engagement rates.
Micro-Influencer Example: A skincare brand paid $2,000 to 10 micro-influencers (10,000-50,000 followers each) in the beauty niche. The campaign generated 8,000 website visits and 80 sales averaging $75 each. With a 65% gross margin typical for skincare, profit was $3,900. Net ROI: ($3,900 / $2,000) × 100 = 195%.
Celebrity Endorsement Example: A supplement company paid $50,000 for a single Instagram post from a celebrity with 2 million followers. The post generated 25,000 website visits but only 60 sales averaging $50 each. With a 70% gross margin, profit was $2,100. Net ROI: ($2,100 / $50,000) × 100 = -96%.
Choose influencers based on engagement rate (3-6% is good) and audience demographics rather than follower count.
Industry-Specific ROI Examples
E-commerce
E-commerce businesses can track ROI more accurately than other industries because most purchases happen immediately online.
Product Advertising Example: An outdoor gear company spent $10,000 on Google Shopping ads for camping equipment. The campaign generated 250 orders with an average order value of $120, totaling $30,000 in revenue. With a 40% gross margin, profit was $12,000. Net ROI: ($12,000 / $10,000) × 100 = 120%.
Customer lifetime value dramatically impacts e-commerce ROI calculations. If the average customer makes 3 purchases over 2 years, the true ROI is 3x higher than first-purchase calculations.
B2B Services
B2B companies must factor in longer sales cycles and higher customer values when calculating ROI.
Lead Generation Example: A consulting firm spent $5,000 monthly on LinkedIn ads targeting VP-level executives. This generated 20 qualified leads monthly, with 2 becoming clients worth $50,000 each annually. With 70% profit margins typical for consulting, annual profit was $70,000. Net ROI: ($70,000 / $60,000 annual ad spend) × 100 = 117%.
Account-based marketing (ABM) often shows negative ROI in the first 6 months but delivers 3-5x higher ROI than broad targeting over 12-18 months.
Local Businesses
Local businesses benefit most from Google My Business optimization and local SEO rather than broad digital advertising.
Local SEO Example: A dental practice spent $3,000 optimizing their Google My Business profile and building local citations. This increased monthly appointment bookings from Google searches by 8 patients averaging $250 per visit. With 60% profit margins typical for dental services, monthly profit increase was $1,200. Annual Net ROI including setup: ($14,400 / $3,000) × 100 = 380%.
Advanced ROI Analysis
Multi-Channel Attribution
Most customers interact with 3-7 marketing touchpoints before purchasing, making single-channel ROI calculations misleading.
Cross-Channel Example: A customer sees a Facebook ad, visits your website, subscribes to your email list, receives 3 emails, searches your brand name on Google, clicks a Google ad, then purchases. Which channel gets credit for the sale?
First-click attribution gives Facebook 100% credit. Last-click gives Google Ads 100% credit. Time-decay attribution splits credit based on proximity to purchase. Linear attribution splits credit equally across all touchpoints.
Identifying the correct multi-channel attribution model can be tricky because it’s difficult to identify correlation versus causation. Unless you already have a pretty savvy marketing team, I’d recommend just relying on first touch, last touch, and linear attribution. Take the linear attribution results with a grain of salt.
Customer Lifetime Value (CLV) Integration
CLV-based ROI calculations show the true profitability of customer acquisition campaigns.
LTV Calculation Example: An online subscription service has these metrics: average monthly subscription price $50, average customer lifespan 18 months, gross margin 70%. Customer Lifetime Profit = $50 × 18 months × 70% = $630.
If customer acquisition costs $200, the Net ROI is ($630 / $200) × 100 = 215%. This allows spending up to $630 on acquisition while maintaining positive ROI.
Short-term ROI might show a Facebook campaign losing money at 30 days, but CLV analysis reveals profitability over the customer lifetime.
Important caveat: Lifetime value is popular primarily among venture-backed companies with significant capital to burn through. The number one killer of businesses is cash flow issues. If it takes three years to become cash flow positive on customer acquisition, you’ll go bankrupt unless you have substantial financial backing. I prefer prioritizing short-term ROI over lifetime value. Campaigns profitable on first purchase create scalable businesses because you generate immediate cash to reinvest in marketing. This creates a flywheel effect where you’re pouring gas on a fire that keeps growing. If breaking even takes too long, you might grow too quickly and go bust.
Brand Awareness ROI
Brand awareness campaigns create indirect value that’s difficult to measure but impacts all other marketing channels.
Brand Lift Study Example: A software company ran display ads focused on brand awareness rather than direct response. Direct attribution showed negative ROI, but brand search volume increased 40% and conversion rates on all other channels improved 15% during the campaign.
Measure brand awareness ROI through branded search volume increases, direct traffic growth, and improved conversion rates across all channels.
The best example of this is traditional advertising. Think of cereal commercials when you were a kid, particularly the Kix commercials with their “Kid tested, Mother approved” slogan. What those commercials were doing was building brand equity. They taught adults that Kix was a healthier option while telling kids the cereal was delicious. There was no direct call to action, no way to purchase from the TV, no phone number to call. Instead, it was laying down general knowledge about the product. So when a mom walked down the grocery store cereal aisle three days later, there was a slightly higher chance she’d see the box and have a positive emotional response. While this is extremely difficult to measure, it’s obviously effective. The marketing industry has thrived for over 100 years based primarily on this type of advertising - not direct sales, but evoking emotional responses. Don’t underestimate the power of brand awareness.
Tools and Methods for ROI Tracking
Analytics Platforms
Google Analytics 4 provides free conversion tracking and attribution modeling for most businesses. Set up Enhanced Ecommerce tracking to measure revenue by traffic source.
For larger businesses, Adobe Analytics or Customer Journey Analytics by Adobe offer more advanced capabilities. My personal preference is Customer Journey Analytics by Adobe because it integrates seamlessly with multiple data sources for cross-dataset reporting.
Marketing automation platforms like HubSpot or Marketo track leads through the entire sales funnel, connecting marketing activities to closed revenue. These tools typically cost $500-5000 monthly but pay for themselves by improving ROI visibility.
CRM integration connects marketing leads to actual sales, especially important for B2B companies with long sales cycles. Salesforce, Pipedrive, and HubSpot CRM all integrate with major advertising platforms.
Reporting and Dashboards
Create weekly ROI dashboards showing spend, conversions, and revenue by channel. Include month-over-month comparisons to identify trends.
Track these KPIs: cost per acquisition (CPA), return on ad spend (ROAS), customer lifetime value (CLV), and marketing qualified leads (MQLs) for B2B.
Automate reporting using tools like Tableau, Microsoft Power BI, or Adobe Customer Journey Analytics (which includes powerful reporting interfaces along with data hosting) to save 5-10 hours weekly on manual report creation.
Common ROI Mistakes and How to Avoid Them
Attribution Errors
Last-click attribution undervalues upper-funnel activities like display ads and social media by giving all credit to the final touchpoint. A customer might see your Facebook ad, then search your brand name and click a Google ad to purchase. Last-click gives Google 100% credit when Facebook deserves partial credit for the initial awareness.
Linear attribution or assisted conversions can show how different channels work together in the customer journey. Channels with high assisted conversion rates may deserve budget even if their last-click ROI appears low. Consider removing different channels one at a time to measure their actual impact on the bottom line. However, don’t confuse correlation with causation since external factors like offers or media publicity can also impact conversion rates.
Cost Calculation Mistakes
Most businesses underestimate true marketing costs by ignoring labor, tools, and overhead expenses. A $1,000 Facebook ad campaign actually costs $1,000 (ad spend) + $500 (creative design) + $300 (management time) + $50 (Facebook Business Manager tools) = $1,850 total investment.
Include these hidden costs: graphic design, video production, landing page development, A/B testing time, campaign management, and tool subscriptions.
Unrealistic Expectations
New campaigns rarely achieve positive ROI in the first 30 days due to algorithm learning periods and optimization requirements. Facebook and Google ads need 50-100 conversions before algorithms optimize effectively.
Industry benchmarks vary dramatically: e-commerce averages 25-50% ROI, B2B services often see 100-300% ROI due to higher customer values, while local businesses might achieve 200-500% ROI from local SEO.
Best Practices for Maximizing Digital Marketing ROI
Campaign Optimization
Run A/B tests on ad creative, landing pages, and audience targeting to improve ROI continuously. A simple headline change can improve conversion rates by 20-50%.
Start with small budgets ($50-100 daily) to test campaign viability before scaling to larger spends. Many campaigns that look profitable at small scale become unprofitable when scaled due to audience saturation.
Data-Driven Decision Making
Increase budgets on campaigns with ROI above your target threshold. If your target ROI is 200% and a Facebook campaign delivers 300% ROI, double the budget and monitor performance.
Pause or reduce budgets on campaigns performing below your minimum acceptable ROI. Don’t let emotional attachment to certain channels or creative assets override data.
Scale successful campaigns by expanding to similar audiences, testing new creative formats, or increasing bids for better ad placement.
Categorize your campaigns across multiple dimensions and look for trends in the categorizations and performance to better understand your customers’ purchasing triggers.
Conclusion
Digital marketing ROI varies dramatically by channel, industry, and execution quality, but following these examples and formulas gives you a framework for measuring and improving your results.
Focus on accurate tracking before optimizing campaigns since you can’t improve what you can’t measure properly. Start with one or two channels, master their ROI tracking, then expand to additional channels.
The businesses that consistently achieve high marketing ROI obsess over data, test continuously, and make budget decisions based on numbers rather than opinions.
Additional Resources
Free Tools: Google Analytics 4, Google Tag Manager, Facebook Pixel Helper, Google Ads Keyword Planner.
Paid Tools: Triple Whale (e-commerce attribution), HubSpot (marketing automation), Supermetrics (reporting automation), Adobe Analytics, Adobe Customer Journey Analytics.